Latest Article Get our latest posts by subscribing this site

Create android apps with android phone

Broadly speaking, writing applications for Android, we always write in the Eclipse or many other programs on the computer. Arrived at this point, they always think that cell phones (mobile devices) may not have enough capacity to compile code, but today's IT nest introduce new software that can be installed on the Android device in order to make the coding different programs at once.


AIDE is an integrated development environment (IDE), which was set up in order to be able to use the Android device can write or develop applications for Android on the device directly.
AIDE can make writing Java console applications or applications that use Java / XML and the Android SDK, as well as applications that use C / C ++ and Android NDK too. AIDE can be compatible with the projects of the Eclipse or Android Studio fully as you can do the coding and transmission sourcecode, or and forth between the phone and computer, or saved in Dropbox. AIDE also be able to support Git for professional development as well.

AIDE also comes with a lesson for the study of Android app development and Java programming. Follow these lessons can be learned that apply on the app project directly.


How to solve the problem Blue Screen - [Windows 8]

Blue Screen of Death all generations for Se thread Windows, Windows 2000, XP, 7 or Windows 8. Some confusion is that the Blue Screen (Error), but in fact, the blue screen is a function to help prevent functional System Fail comes with a code error to tell users about these problems.


Learn about the roots of the problem

Error Code

The most important information that can help solve the problem, the Blue Screen Error Code. This Code will help you to know why and how to solve them. Do not forget to note it at the blue screen shows up.


Once you have the error code from the blue screen, you simply go to a search engine such as Google or Bing, and enter the error code, and press Enter. You'll get a lot of information to fix the error that caused a blue screen effect.

If you did not notice, or not yet, or accidentally missed, so please do not worry, Windows Memory Dump Files Blue Screen, but that it is difficult to see that information through tools like this, you can use Windows programs NirSoft's BlueScreenView instead " Bug Check String "is an error code only once.


You can also configure the Windows error dumps for when the blue screens occur if Windows does not automatically configue. To do this, you will have to open the Control Panel> System> Advanced system settings and then click the Settings button in the Startup and Recovery. Write Debugging Information Select Automatic Memory Dumps ready. 


Action Center

As a source of information that you can find information about the problem of Blue Screen and Application Crashes. You can find the Action Center Task Bar lower right side near the clock or go to the Control Panel.


Windows Event Viewer
 
Application Crashes usually you can go to the Windows Event Viewer log. Press Win + X and select Event Viewer is optional.


Problem solution


If you can not find anything related to your problem through searching online, you can try Common test methods including the following: 

Update DriversBlue Screen can be caused by hardware drivers such as in the case of Windows 8 will be released, and you have installed the Old Driver Version (for Windows 7). Try tracking and Driver search for the latest generation of hardware. This can help fix updates Crashes and other problems with the process of the hardware in the OS.


Uninstall via Safe Mode

Blue Screen may occur due to some hardware drivers or software. You will need to boot into Safe Mode and Uninstall Driver or Software Package that you recently installed. To go into Safe Mode in Windows Follow the steps below:

    Click Win + I to display the Sidebar Menu
    Then click on the Power button
    Then press Shift and click together on the restart. 


Learn about Google Chrome Devtools

Chrome Developer Tools or DevTools is a tool to manage and debug code that is shipped with the Google Chrome browser will direct. DevTools tool allows Web Developers (Web Developer) to access the interior of the web page, along with their Web Application easily. DevTools you can search quickly the problem with the layout, breakpoint settings for JavaScript and a clear understanding of code optimization.


How to use DevTools

To opt-out to use it, you will need to open a website and then you can:

    Click on the icon of the Chrome menu on the right-hand side, then click Tools> Developer Tools
    Right-click on the (element) and select Inspect Element.

Tab of the device will show up at the bottom of your Chrome browser. 


Shortcut keys

The following are a few shortcut keys that you can use to access the fastest:

    Press Ctrl + Shift + I or Cmd + Opt + I (Mac) to open the tab DevTools
    Press Ctrl + Shift + J or Cmd + Opt + J (Mac) to open the Direct Console
    Press Ctrl + Shift + C or Cmd + Shift + C (for Mac) T to open directly into the Inspect Element.


DevTools tab 


Control Document Object Model (DOM) and Styles 

Elements tab allows you to see everything about the various elements in a tree view that easy and fast. You can edit directly in the code, just double click on the tag or element, or right-click and choose Edit as HTML to edit the HTML code only once. For more detailed functions, you can go here. 


About using the Console 

JavaScript Console will provide two important functions for the developer to pilot test sites as well as web applications:

    Where maintaining contains log information by using methods that are in the same Console API console.log (), or console.profile ().
    A place where you can type in commands to use DevTools with other document files. You can use the methods that are in the command line API, such as (a), a command for select elements. 


Debug JavaScript 

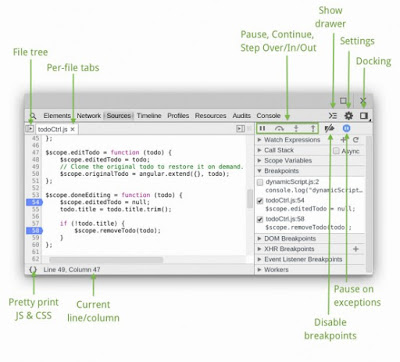
You can use the Sources tab to debug JavaScript more quickly and easily with various aids. It allows you to view all the Scripts in the page, and more specifically with the controls such as pause, resume, or step can help you to manage the process of code very easily. For more information about the process to debug JavaScript, you can go here. 


Network Performance 

Network a tab that allows you to check the Resources to download on the network in that time (Real Time). You can check and Optimize your Page if Identify and Address Request were long. To find out more about this, click here. 


Audit Panel 

Audit tab allows you to scan a page based on its load and provide feedback to reduce more quicklytime to load page. To control if you can install the extension PageSpeed. 


 Rendering Performance

The Timeline tab, you can check where many used to load a Web App or your page. All eventWhether loading resources, parsing JavaScript, calculating styles, or repainting, but also have been shown on the timeline. If you want to know more details about this panel, please click here. 


JavaScript & CSS performance

Profiles tab allows you to check for execution, along with the memory usage of the Web App or your Page. Panel profiles are integrated with the profiler also some CPU profiler, JavaScript profiler and a Heap profiler. This will help you to understand more clearly how the resources are being used anywhere, and will also facilitate the Optimize your code as well.

    CPU profiler tells you where a lot of use in the execution of your JavaScript function.
    Heap profiler will show the memory distribution by JavaScript objects and DOM other related.
    JavaScript profiler shows where execution in your script.


Storage Control

 Resources are an important place that allows you to review the resource load up the webpage. To be more clear on this section, you can read more here.


Powered by Blogger.

About

 
Support : Your Link | Your Link | Your Link
Copyright © 2013. Blogger Tips - All Rights Reserved
Template Created by Creating Website Published by Mas Template
Proudly powered by Blogger