How to use DevTools
To opt-out to use it, you will need to open a website and then you can:Click on the icon of the Chrome menu on the right-hand side, then click Tools> Developer Tools
Right-click on the (element) and select Inspect Element.
Tab of the device will show up at the bottom of your Chrome browser.
Shortcut keys
The following are a few shortcut keys that you can use to access the fastest:Press Ctrl + Shift + I or Cmd + Opt + I (Mac) to open the tab DevTools
Press Ctrl + Shift + J or Cmd + Opt + J (Mac) to open the Direct Console
Press Ctrl + Shift + C or Cmd + Shift + C (for Mac) T to open directly into the Inspect Element.
DevTools tab
Control Document Object Model (DOM) and Styles
Elements tab allows you to see everything about the various elements in a tree view that easy and fast. You can edit directly in the code, just double click on the tag or element, or right-click and choose Edit as HTML to edit the HTML code only once. For more detailed functions, you can go here.About using the Console
JavaScript Console will provide two important functions for the developer to pilot test sites as well as web applications:Where maintaining contains log information by using methods that are in the same Console API console.log (), or console.profile ().
A place where you can type in commands to use DevTools with other document files. You can use the methods that are in the command line API, such as (a), a command for select elements.
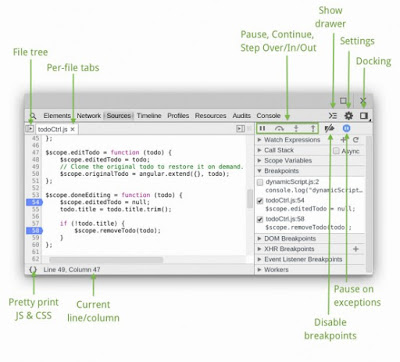
Debug JavaScript
You can use the Sources tab to debug JavaScript more quickly and easily with various aids. It allows you to view all the Scripts in the page, and more specifically with the controls such as pause, resume, or step can help you to manage the process of code very easily. For more information about the process to debug JavaScript, you can go here.Network Performance
Network a tab that allows you to check the Resources to download on the network in that time (Real Time). You can check and Optimize your Page if Identify and Address Request were long. To find out more about this, click here.Audit Panel
Audit tab allows you to scan a page based on its load and provide feedback to reduce more quicklytime to load page. To control if you can install the extension PageSpeed.Rendering Performance
The Timeline tab, you can check where many used to load a Web App or your page. All eventWhether loading resources, parsing JavaScript, calculating styles, or repainting, but also have been shown on the timeline. If you want to know more details about this panel, please click here.JavaScript & CSS performance
Profiles tab allows you to check for execution, along with the memory usage of the Web App or your Page. Panel profiles are integrated with the profiler also some CPU profiler, JavaScript profiler and a Heap profiler. This will help you to understand more clearly how the resources are being used anywhere, and will also facilitate the Optimize your code as well.CPU profiler tells you where a lot of use in the execution of your JavaScript function.
Heap profiler will show the memory distribution by JavaScript objects and DOM other related.
JavaScript profiler shows where execution in your script.


0 comments:
Post a Comment